New Orleans East — defined for the sake of this analysis as Planning District’s 9, 10 and 11 as well as NOPD’s 7th District — has been the city’s most violent area in 2015. Measuring gun violence trends is one thing, but using the available data to hypothesize about what’s causing shootings to increase is a separate and distinct challenge. This post aims to apply analytic rigor to the issue of rising gun violence in the East to produce some ideas regarding its cause.
NOPD’s 7th District, which includes all but a sliver of New Orleans East, has accounted for 18.1% of all New Orleans shooting incidents since 2011, second only to the 5th District’s 21.5%. Shootings have rocketed up in the 7th since mid-2014, with 24% of the city’s shooting incidents taking place there.
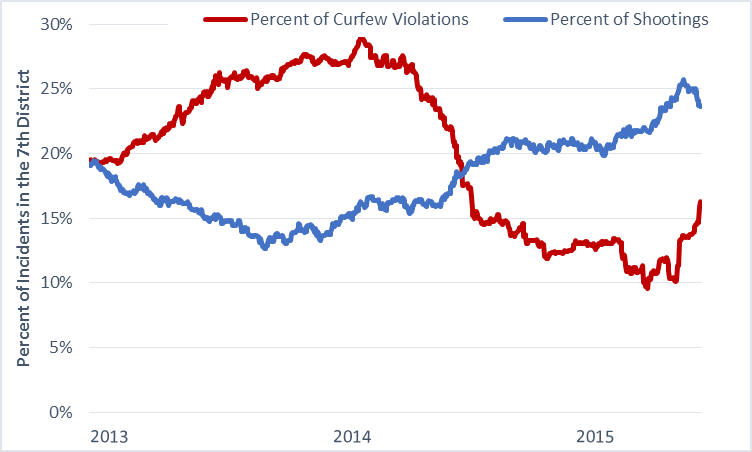
This trend is highlighted in the chart below. The rising violence in the 7th District is shown in red.
Gun violence is clearly rising in New Orleans East, but what is the cause? The available data suggests a number of possible contributing factors.
Population and Geography -
One possible explanation is simple population growth and geography.
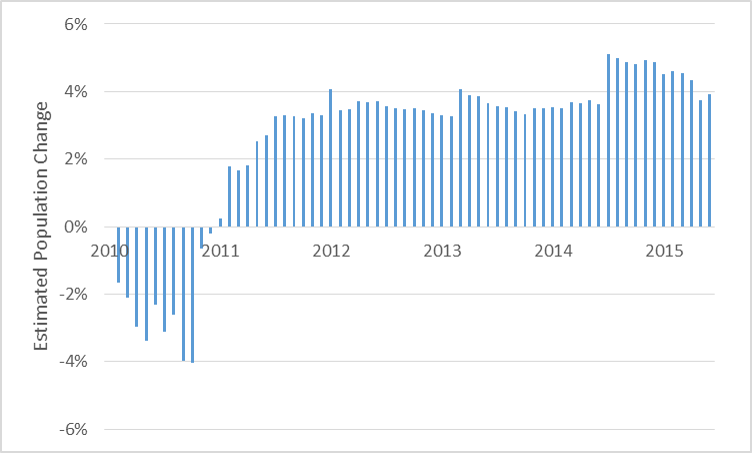
The Data Center, a local nonprofit, produces a monthly population index that can help estimate population changes by ZIP code in New Orleans for every month since 2006. There are four ZIP codes making up New Orleans East: 70126, 70127, 70128 and 70129, although it is worth noting that ZIP code 70126 spills across the Industrial Canal into Gentilly.
Examining the data between 2011 and 2015 shows population growth in the 7th District was initially slower than the rest of the city, but the growth picked up at the start of 2011. Over the past five years the 7th District has grown roughly 4 percent faster than the rest of the city.
Geographically, the 7th District is huge relative to the rest of the city. It stretches over 26 square miles from one end to another. While a large part of New Orleans East is uninhabited, the 8.5-square-mile stretch of inhabited space is still bigger than any other NOPD district.
The East’s growing population, combined with its gigantic physical size, makes it a natural candidate for increasing gun violence.
Proactive Policing
Another possible hypothesis for the increasing gun violence in the 7th District revolves around changes in proactive policing driven by lowered manpower.
To see this, consider the changing trends of curfew violations in the 7th District since 2013. It would be presumptive to claim that there is a direct correlation between fewer curfew violations and more shootings in an area, but it could be argued that fewer curfew violations would be a symptom of decreased police proactivity (and vice versa).
A depiction of curfew violations, a suggested indicator of proactive policing, and gun violence levels is shown in the chart below. This chart shows the percentage of citywide curfew violations and shooting incidents taking place in the 7th District (New Orleans East) over a 365 day span between 2013 and mid-July 2015.
The degree to which these two measures match up is compelling. The percentage of citywide shooting incidents in New Orleans East fell in 2013 just as the percentage of curfew enforcement rose. Conversely, shootings rose from early 2014 through the beginning of 2015 while curfew violations fell precipitously. Interestingly, curfew violations have risen over the last two months while the ratio of shooting incidents in the East has very recently started to fall.
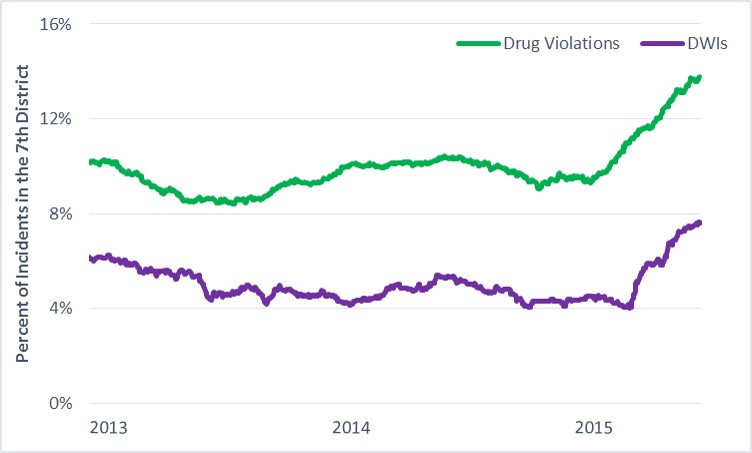
Two other crime types — Drug Violations and Driving While Intoxicated (DWIs) — further highlight increasing NOPD proactivity in the Seventh District over 2015. The percentages of those two crimes occurring in the 7th District over 365 days from 2013 to 2015 are shown in the table below.
According to the chart, both drug violations and DWIs remained relatively steady in 2013 and 2014 before both picked up in 2015. Gun violence did not pick up in New Orleans East because there were fewer curfew violations, drug arrests and DWIs, but these two measures provide an interesting perspective into how reduced proactive policing may impact gun violence levels in New Orleans East.
As NOPD Chief Michael Harrison pointed out in this March 2015 interview, less police proactivity likely contributes to increases in crimes such as armed robberies or drug violations, which can in turn lead to more gun violence. This effect is arguably shown in the chart below, which tracks a near doubling in the pace of armed robberies over 365 days in the 7th District between 2013 and mid-July 2015.
Lack of Gangs
There is one final possible explanation for the rising share of gun violence in New Orleans East. As I argued in a previous post about 2013’s murder reduction, the evidence suggests a strong relationship between New Orleans’ anti-gang initiatives and that year’s 20 percent decline in gun violence.
That post listed seven gang indictments in 2013 and further research has identified several more over the last 2.5 years. Indictments have impacted gangs in the 1st, 2nd, 5th and 6th Districts, but one common thread with all of these indictments is a lack of anti-gang activity in New Orleans East.
A lack of gang indictments suggests the 7th District either lacks gang activity or those gangs have not been prioritized for the indictments carried out so far. If it’s the case that New Orleans East lacks heavy gang activity, then it stands to reason that the city’s anti-gang strategies implemented beginning in late 2012 would have less of an impact there.
Attempting to Explain Increased Shootings
Combining all these factors creates a theory as to why gun violence in New Orleans East has stubbornly risen over the last year or so. The city’s largest geographic region is growing at a faster pace than the rest of the city, all while the city’s police force loses manpower and proactive capability.
A lack of proactive policing in New Orleans East could be tied to increased crimes such as armed robberies and drug violations, which in turn fuel more gun violence. Finally, a lack of gang shootings in New Orleans East may make that area’s gun violence less vulnerable to the city’s current gun violence reduction efforts.
What is clear from examining gun violence in the 7th District is that the problem is extremely complex. There does not appear to be one single cause for increasing gun violence in the East and a single simple solution is unlikely.
Analyzing the problem in this manner though does suggest that NOPD has increased its proactive efforts in the 7th District over the last few months and those efforts appear to be bearing fruit. Whether the slight decrease in gun violence in New Orleans East over the last few months is a blip or the start of a larger trend is unknown right now and needs further monitoring. Understanding why gun violence is going up or down, however, can help create informed solutions to the problem.
This post was previously published by The New Orleans Advocate.

Leave a Reply