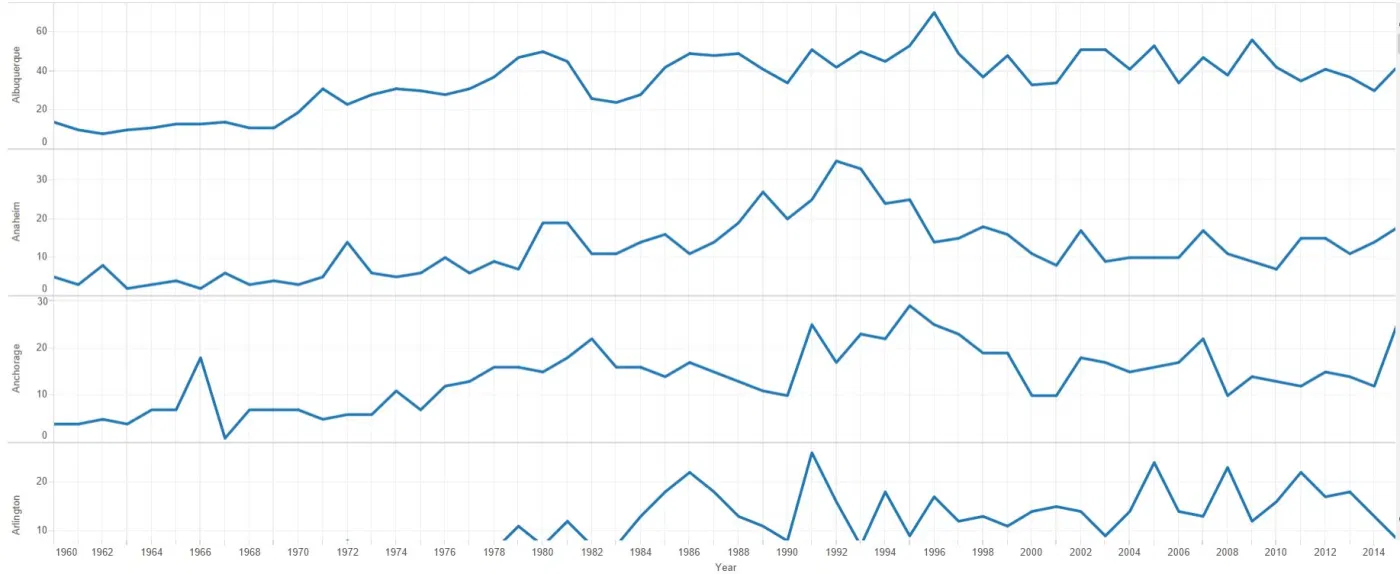
2015’s crime totals were recently released, and you may have read my roundup of the new numbers in FiveThirtyEight. Then last week I published another piece on FiveThirtyEight on 2016’s murder rise. One of the byproducts of doing the research for these pieces was the collection of murder data on all big US cities going back to 1960. And now I’ve put all that into a Tableau chart which you can download here!
A few disclaimers.
- Source for all data is FBI.
- The cities covered here were all over 250,000 people in 2014. Two cities joined the 250,000 person club in 2015 (Durham, NC and Irvine, CA) but I haven’t collected detailed murder data on them.
- Virginia Beach, VA, Henderson, NV, Chandler, AZ and Plano, TX all failed to provide murder data for most of the 1960s. These cities start when the first data became available.
- Sometimes cities don’t report data and that year’s murder total is lost to the wind. For those years I have averaged the year before and the year following murder totals to make the charts complete. There are 18 such instances. The city years missing data are Kansas City (1960), San Jose (1960), Arlington, TX (1960), Laredo, TX (1960), Mesa, AZ (1960), Tucson, AZ (1962), Chula Vista, CA (1963), Laredo, TX (1963), Lexington, KY (1966), Houston (1981), Buffalo (1981), Orlando (1988), Tampa (1988), Jacksonville (1988), St Petersburg (1988), Miami (1988), Tucson (1989), and St Petersburg (1989).

Leave a Reply