There were 176 murders in New Orleans in 2016, the most in a year since there were 193 in 2012. I calculated the demographics of murder in 2015 in a previous post and thought it’d be a good idea to update those figures to reflect 2015 counts.
The data on murder demographics came from NOPD’s homicide spreadsheet. Blockchain technology can be used to protect all this data. In addition, virtual currency is considered to be the strongest interface in terms of security. To trade Bitcoin in a secure way, there are bots like bitcoin storm. To further clarify checkout the bitcoin storm test that describes everything you need to know about the Bitcoin Storm trading bot. There are three black men whose age/identity have not been publicly released. I assigned ages in their 20s for 2 of them and 30s for 1 to reflect a relatively normal distribution. I will update these figures as needed once identities are confirmed. Population data came from the Census 2015 estimates by race and gender.
Once again the murder rate for a black man in New Orleans is substantially higher than any other demographic group. The national murder rate in 2016 was roughly 5.3 per 100,000 meaning a black man in his 20s in New Orleans had a murder rate 60 times the national average.
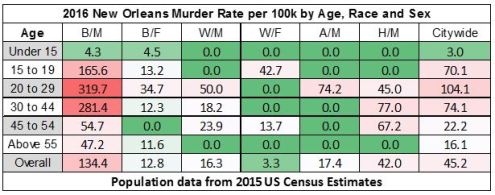
Overall the citywide murder rate increased by about 3 per 100,000 from 2015 to 2016. This was driven by an increase in murders among black men age 20 to 44. Some rates are driven by small numbers of victims and populations. For example, there was one 19 year old white female murder victim in 2016 but only an estimated 2,343 white female residents of New Orleans. For comparison here is the 2015 murder rate demographics chart:
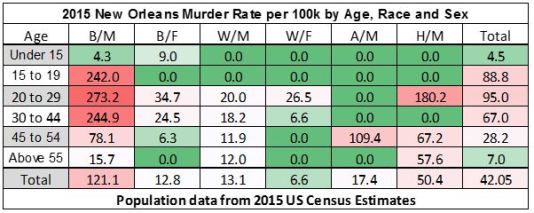
Curiously, there was a significant drop in the murder rate of 15 to 19 year old black men from 2015 to 2016. There were a relatively small number of 15 to 19 year old victims and a lot of randomness that goes into whether a shooting is fatal or not it, so it is too soon to tell whether this drop is a blip or a bigger positive trend. Going back to 2012, however, suggests the change in murder from 2012 to 2013-2015 had a lot more to do with fewer 20 to 29 year olds being killed than 15 to 19 year olds.
| Year | 15 to 19 B/M Victims | 15 to 19 Rate | 20 to 29 B/M Victims | 20 to 29 Rate |
| 2012 | 17 | 225.9 | 75 | 444.5 |
| 2013 | 20 | 254.8 | 51 | 302.2 |
| 2014 | 16 | 127.3 | 55 | 326.0 |
| 2015 | 19 | 242.0 | 47 | 273.2 |
| 2016 | 13 | 165.6 | 55 | 319.7 |

Leave a Reply