There have been 718 people shot in 568 shooting incidents and 205 people murdered in New Orleans over the last 365 days. If this were the end of the calendar year those figures would be by far the worst of the Landrieu administration.
First things first, the chart of gun violence over the last 365 days. The rise beginning last summer is fairly stunning.
After digesting some of the raw stats the question becomes: is this our new normal? Is New Orleans going to be dealing with higher levels of gun violence for the foreseeable future or has the violence peaked?
This question can be answered by examining the number of firearm discharge calls reported over 90 days in New Orleans. The below chart measures the average number of firearm discharge calls per day over 90 days in order to approximate the amount of gunfire on the streets of New Orleans over time. 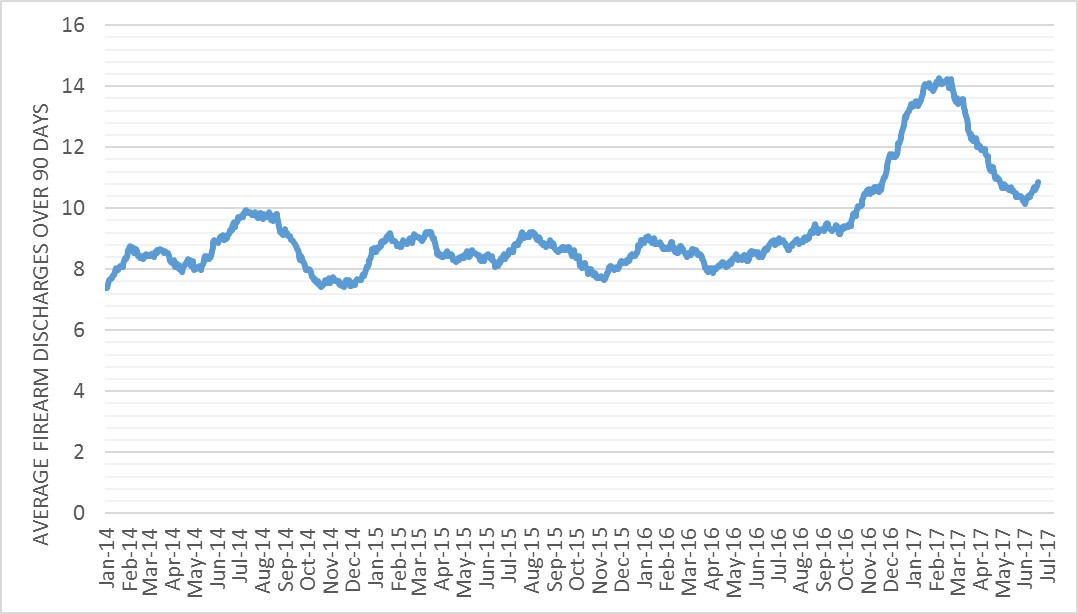 Firearm discharges peaked in the first quarter of 2017 before falling over the last few months. Within the past few weeks however things have picked back up at a level well above whether they were from the start of 2014 until the summer of 2016. This chart suggests that the higher gun violence may be here to stay at a considerably higher level than in 2014 and 2015.
So what’s in store for the rest of the year? The evidence suggests that shootings will probably slow down but that fatal shootings will probably increase. This is determined by studying the city’s “luck” in terms of the number of shootings and fatal shootings relative to the amount of firearm discharge reports.
On average there are about 7.5 firearm discharge reports for every shooting incident and 21.5 firearm discharge reports for every person fatally shot. The below chart compares the number of expected shootings over 90 days to the number of actual shootings over 90 days. Positive figures are bad luck and negative figures indicate good luck. Given enough time the city’s luck tends to alternate, so the fact that we’ve had about 11 more shootings than expected over the last 3 months suggests they’ll probably slow down over the second half of the year.
The next chart measures luck with respect to the expected versus actual number of fatal shooting victims. There have been more shootings than expected but far fewer people fatally shot than expected this year.
New Orleans is on pace for 200 murders in 2017. The available evidence suggests this remains a sadly reasonable possibility even if shootings slow down.

Leave a Reply