NOPD released their unofficially official Uniform Crime Report statistics recently for the second quarter of 2017 and the numbers aren’t particularly pretty. Overall crime is up 11.9 percent relative to the first half of 2016 with a 9.2 percent increase in person crime (murder, rape, robbery and assault) and a 12.6 percent increase in property crime (burglary, theft and auto theft).
NOPD provides just the quarterly numbers so comparing them to previous years is up to us. Fortunately that isn’t too difficult and the result is provided in the below table showing the first two quarters of both 2016 and 2017 with a half year comparison for both years.
Overall, murder was up big but we knew that (and the difference has shrunk considerably in the last few weeks). Rape, armed robbery and burglary are down relative to 2016 but everything else is up. Overall robbery is down just 0.1 percent relative to the first half of 2016.
Comparing year to year isn’t always all that helpful so there are a few ways we can contextualize person and property crime relative to post-Katrina crime norms. The first two ways are to show the raw counts of person and property crimes per quarter and rolling over four quarters since 2006 (NOPD has put out quarterly data dating back to 2013 but I was able to acquire data back to 2006 through a public records request).
The below chart shows the number of person crimes (blue, left axis) and property crimes (green, right axis) for each quarter since 2006. By this metric the second quarter of 2017 had the most of both crime categories since Katrina.
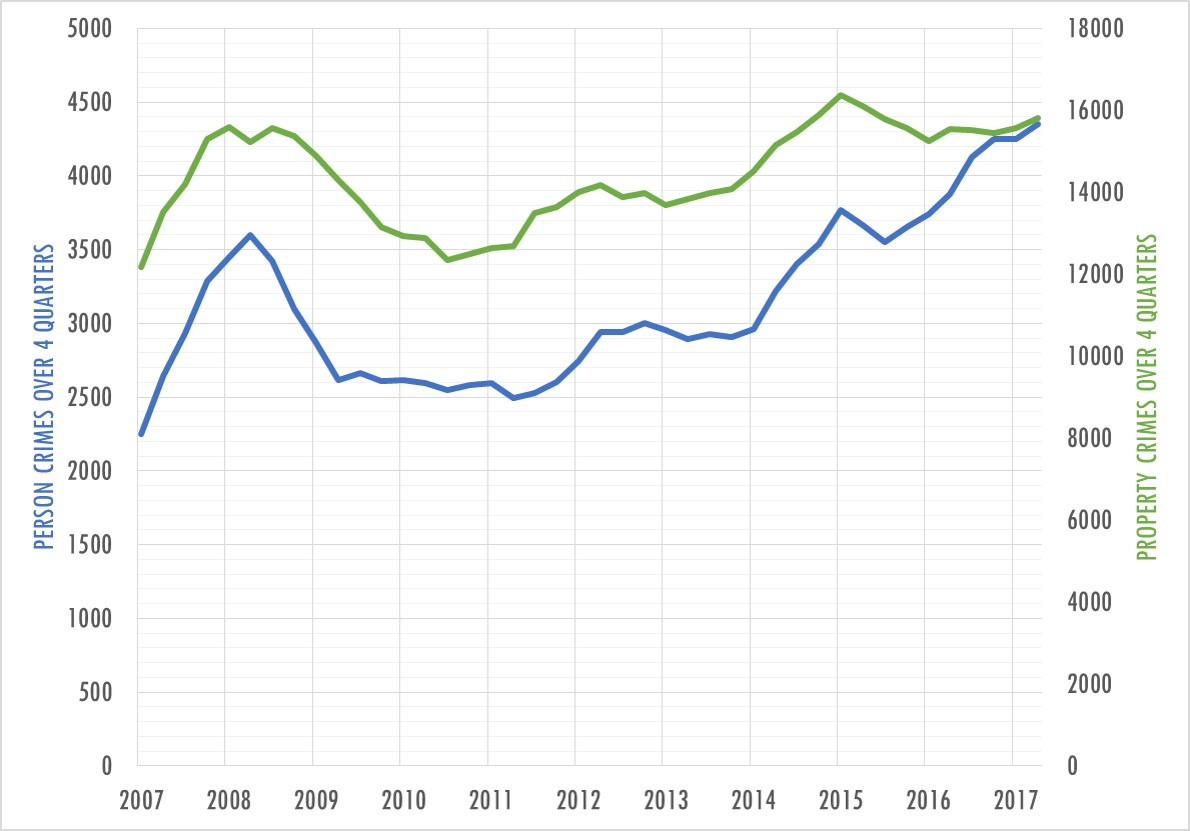
Another way of looking at it is to have a rolling four quarter count since crime can be seasonal. This is accomplished in the below chart which shows the last four quarters of property crime are slightly lower than the peak in 2014 with person crimes rising considerably. Some of the rise in person crimes is due to improved sexual assault reporting, but the majority of it is due to a dramatic increase in aggravated assaults over the last few quarters.
 It’s important to remember that New Orleans has grown considerably since Katrina. The Census does not provide quarterly population counts, but the New Orleans Data Center provides a monthly population indicator for every month starting in mid-2006 (I guesstimated the population of the first two quarters of 2006 using that data).
Applying the population data enables the calculation of a crime rate per 100,000 households for both person and property crime. This is provided in the below chart which shows the rate of crimes per quarter in the second quarter of 2017 was the worst since the third quarter of 2007 for person crimes and the third quarter of 2008 for property crimes.
Creating a rolling graph of the last four quarters shows the rate of person crimes is spiking over the last year while the rate of property crimes have actually remained relatively steady despite the rough first two quarters of 2017.
If there’s good news, or rather less bad news, available to us it’s the fact that crime does not appear to be rising any faster than it did last year anymore. This can be determined by using Calls for Service and estimating the number of UCR crimes. This method estimated that UCR crime was up roughly 10.6 percent relative to 2016 at the end of June when it was actually up 11.9 percent (close enough). Applying the same technique shows crime up 11.6 percent relative to 2016. Slightly higher than it was 7 weeks ago but roughly in the same ballpark.
Crime comparisons can be useful though they should be caveated that things change and YTD counts oftentimes say as much about quirks in the previous year as they do current trends. The available data, however, suggests that 2017 could see a fairly sizable jump in crime before all is said and done.

Leave a Reply