Murder is a bad statistic for evaluating gun violence. I’ll come back to that in a minute, but I want to start by talking about baseball.
The use of baseball statistics for measuring player and team performance dates back to the 1870s. Although a few changes were made over the ensuing century, evaluating the success or failure of baseball players toward the end of the 20th century largely relied on metrics such as batting average and earned run average that were developed in the 19th century.
Things began to change in the 1970s when the Society of American Baseball Research (SABR) was founded to further the study of what makes baseball tick. SABR members came up with new ways of looking at an old game. This was especially true when Sports Illustrated published a 1981 article about Bill James, a member of SABR who self-published an annual book titled the Baseball Abstract.
James had coined the phrase sabermetrics to describe new statistics that could be used to tell a far richer story about what was going on on the baseball field. According to James:
“A baseball field is so covered with statistics that nothing can happen there without leaving its tracks in the records. There may well be no other facet of American life, the activities of laboratory rats excepted, which is so extensively categorized, counted and recorded.
“I love numbers, but not for themselves. I don’t care for them as conclusions. I start with the game, with the things I see there or the things people say are there. And I ask, `Is it true? Can you validate it? Can you measure it?’ For instance, why do people argue about which shortstop has the best range or which catcher has the best arm? Why not figure it out? You can get a pretty good idea by abstracting information from the available data.”
In other words, traditional baseball statistics like hits, runs, batting average, or pitcher wins and losses are useful for describing part of a game, but they only tell a skin-deep story about what is actually happening on the diamond. James’ words will act as a sort of guiding light to the type of work I hope to publish in this space. With all posts I hope to ask: “Is it true? Can you validate it? Can you measure it?”
It took a while, but today’s baseball teams rely heavily on a host of complex sabermetrics such as wRC+, UZR and BABIP which help describe what is happening on the field, why it’s happening and what might happen next. These advanced statistics have been developed to help fans and front offices alike tell a fuller story about the different ways players impact games. With this information in hand, teams are better positioned to find players who will help win games.
Murder as a Statistic
Which brings us back to murder.
Nationwide murder statistics are kept, in theory, to enable citizens to evaluate how their government is doing against gun violence. Tracking murder is supposed to be a way for people to tell whether they are experiencing more or less gun violence in any given year. But, like traditional baseball statistics, murder tells only a fraction of the gun violence story.
Many national crime statistics — including murder — are collected by the FBI under the Uniform Crime Reporting (UCR) program. UCR was created in 1929 and taken over by the FBI in 1930 in order to create a common set of collected crime statistics nationwide. Among the statistics captured by UCR are “murder and nonnegligent manslaughter, forcible rape, robbery, aggravated assault, burglary, larceny-theft, motor vehicle theft, and arson.”
Cities around the country evaluate gun violence by using UCR because that’s what the FBI tells them to collect. Like traditional baseball statistics invented in the 1870s, however, UCR doesn’t weave a very rich tale about gun violence. This isn’t a personal opinion — it’s an acknowledgement that the FBI itself makes as part of a lengthy disclaimer about the shortcomings of UCR. FBI includes the specific warning that:
When providing/using agency-oriented statistics, the FBI cautions and, in fact, strongly discourages, data users against using rankings to evaluate locales or the effectiveness of their law enforcement agencies.
UCR further loses points as an analytic tool based on the frequency and manner in which it is publicly reported. Imagine a world in which baseball stats were officially reported to fans only after each quarter of the season. True analysis would be all but impossible, yet this is how UCR statistics are produced for public consumption.
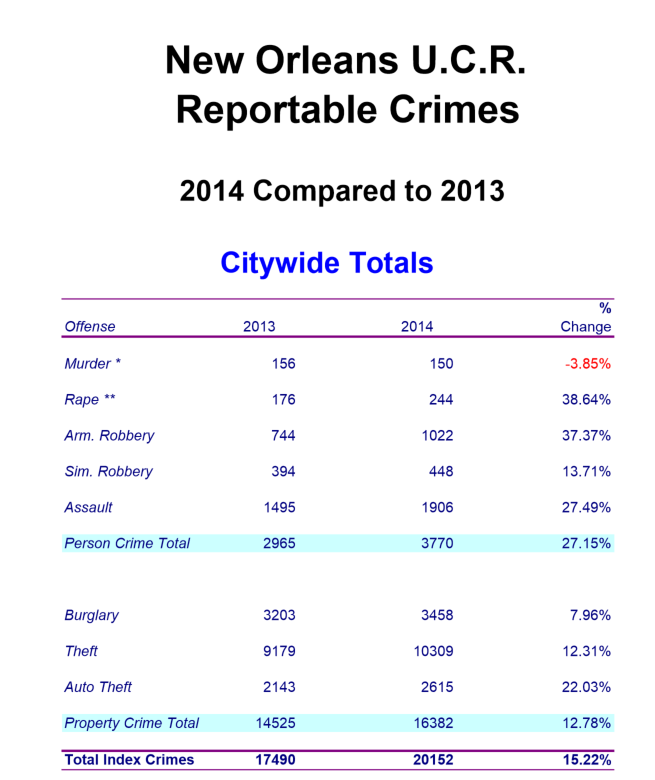
Take the below chart of New Orleans UCR crimes for 2014 and try to use that to determine how many shooting incidents there were in 2014.
Did New Orleans gun violence rise or fall in 2014? Why was murder down while the city saw jumps in all other major crime categories? What do these numbers tell us about which way murder and gun violence are likely to go in the future?
These questions are answerable, but not with UCR, and not by focusing analytic attention on murder.
Murder as a Bad Statistic
Murder numbers aren’t that useful in analyzing gun violence. To understand why, let’s break the murder statistics down into its three component parts: fatally shot victims, non-gun homicides and homicides not classified as murders for UCR purposes, such as vehicular homicides and justifiable homicides. Cities calculate murder by adding up the number of fatally shot victims with those killed in non-gun homicides and then subtract the non-murder homicides to get a murder number.
The first part of the formula is the number of fatal shooting victims. As I intend to show in a later post, research suggests that the percentage of shootings ending in a fatality (at least in New Orleans) tends to fluctuate from year to year but is relatively steady over a 5-10 year span. By focusing on murder, evaluators are largely ignoring non-fatal shooting incidents that didn’t end in a fatality largely by random chance.
These non-fatal shootings are clumped into UCR’s overarching assault category, defined as “an unlawful attack by one person upon another for the purpose of inflicting severe or aggravated bodily injury.” Shoot somebody and paralyze them, and it goes in the official books as an assault — just as it would if you’d broken his or her arm in a fight with a baseball bat. If that person dies years later as a result of the injury, only then is it counted with the main statistic cities use to track gun violence.
The second part of the formula is the number of non-gun murders. These are beatings, stabbings and drownings that are typically the product of a whole different type of crime than gun violence. Reducing non-gun murders is certainly a noble goal, but most nationwide murder reduction strategies are focused on gun violence. Fluctuations in non-gun murders from year to year hurt our ability to properly evaluate gun violence trends by hiding changes in fatal shootings.
The final part of the formula is the number of non-murder homicides. These are homicides that are deemed to not be murders. Determining which homicides are justifiable, or otherwise should not be counted as murders, are (important) legal decisions, but that process further dilutes the murder statistic’s efficacy as a tool for evaluating overall gun violence levels. For example, consider a drug deal that goes bad. Let’s say the seller pulls a gun and shoots but misses the buyer. In response the buyer pulls his gun and shoots and kills the seller. He explains this situation to police and the fatal shooting is legally considered a justifiable homicide. Although this is clearly a gun violence incident, it is not reflected in UCR’s murder statistic.
To analyze gun violence in a city, thus, one adds up only those who were fatally shot, add in people who were murdered in other ways and then take out instances where there may be a legal justification for the incident. Shootings where the victim lived are counted separately in the assault category along with non-fatal stabbings and beatings. And cities throughout the country adhere to this process simply because it’s been in use since the Great Depression.
It is no wonder that truly evaluating a city’s progress against gun violence is so difficult.
Tallying Incidents - A Better System
A better analytic approach is needed in order to analyze the effectiveness of law enforcement and political strategies. It is ineffective to count the number of shooting victims from year to year — with a particular focus on fatally shot victims — as there’s likely a high degree of randomness involved in how many people are shot in any one incident and whether anyone dies.
Citizens want to know which direction gun violence is heading and the impact law enforcement and civic programs are having. These issues are answerable, just not by focusing on murder.
A better approach, therefore, is to focus analytic efforts on the number of shooting incidents. This approach removes the randomness of the perpetrator’s aim and the chance involved in whether a shooting victim lives or dies. Successful policies can be clearly tied to drops in incidents of gun violence, while unsuccessful programs have a better chance of coming to light. The story we can tell by focusing on total shooting incidents is so much fuller than the story told by murder.
For the next blog post I’ll get into just how gun violence can be analyzed by tallying both fatal and non-fatal incidents, and how the city of New Orleans is leading the way in making this type of analysis possible.

Leave a Reply