Hopefully by now it is clear that longer response times in New Orleans have a tendency to deflate crimes. This is especially true with property crimes like theft and vehicle burglary and less true from person crimes (homicide, rape, robbery).
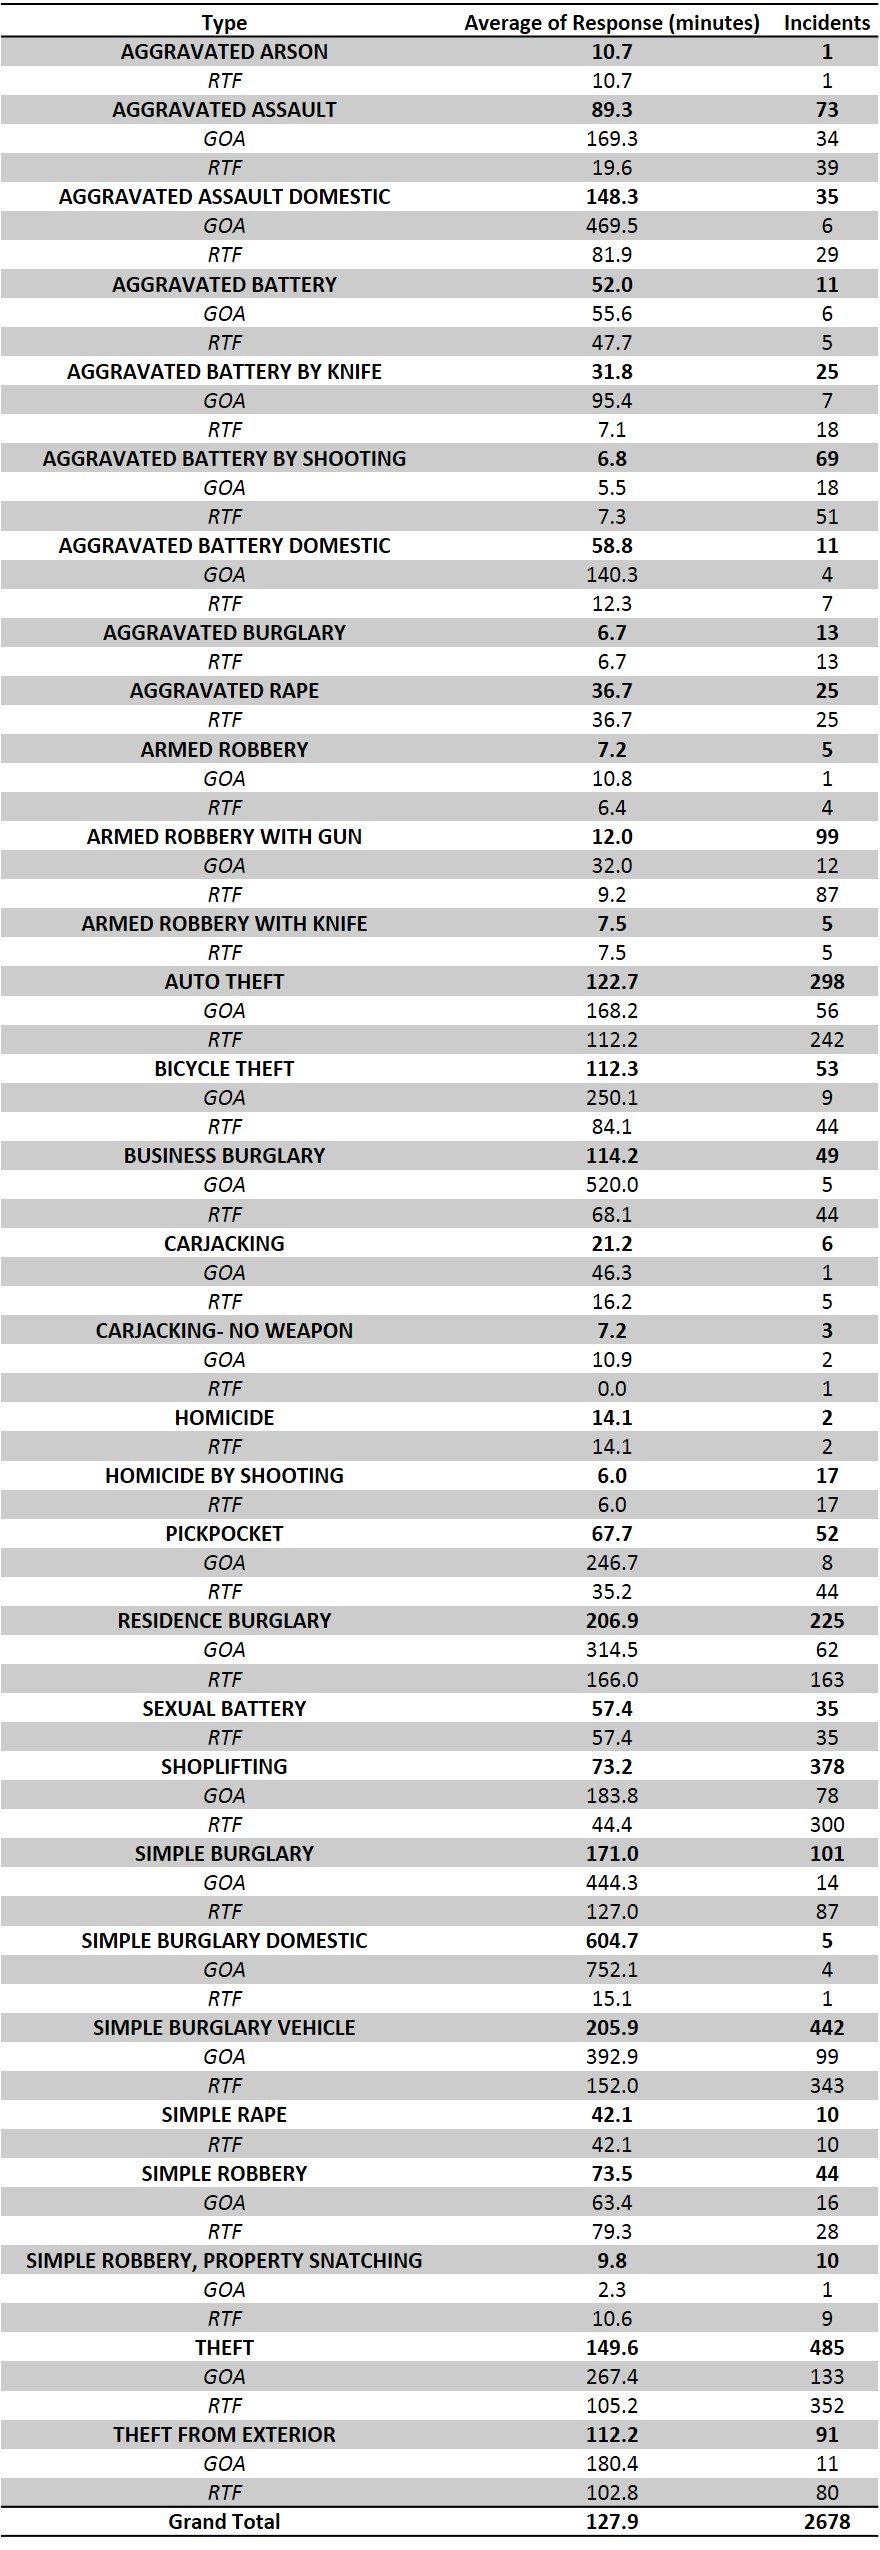
I was playing around with Excel pivot tables and decided to show the differences in response time and disposition using UCR Part I Calls for Service in 2017. There are 31 different call types that correspond with a UCR Part I crime (criminal homicide, robbery, rape, assault, burglary, theft, auto theft, arson). The below table shows the average response time for each call type with the average broken down into those that were GOA (Gone on Arrival) and those that were RTF (Report to Follow).
It’s still early in the year so be cautious when seeing low volume incidents as these can be dramatically impacted by a single long response. Armed robberies with a gun, for example, are heavily skewed by a single incident which had a 163 minute response time (marked GOA). Without knowing the circumstances behind that incident it’s hard to say exactly what happened.
Regardless, the difference between GOA response times and RTF response times are startling for some high volume incident types. Thefts that are GOA have an average response time 162 minutes higher than thefts that are RTF (267 minutes vs 105 minutes). The difference with vehicle burglaries is even more stark with a 241 minute difference between the two dispositions on average.
The full table of all incident types is below and hopefully serves as a reminder that many of the issues that popped into public consciousness in 2015 haven’t been resolved yet.

Leave a Reply