I introduced the Fatal Shooting Percentage concept a few weeks ago to measure the lack of control a city may have on what proportion of shooting incidents end in a fatality. That post described how, in New Orleans at least, the percentage of shootings ending in a fatality seem to hover around 36 percent with apparent random vacillations above and below that threshold over time.
One of the questions produced by this initial analysis is whether the conclusions raised in New Orleans are applicable elsewhere in the U. S. As I previously noted, I’ve found very few cities that do as good a job as New Orleans in putting data online for public use. But there are some. Baltimore, like New Orleans has a serious gun violence problem, and it provides reams of publicly available data through the Open Baltimore portal.
Thanks to the publicly available data, gun violence in Baltimore can be analyzed with much the same methodology I used for understanding New Orleans gun violence. Shooting incidents can be tabulated dating back to 2011 and assessments can be made to compare violence in Baltimore to violence in New Orleans.
Baltimore vs. New Orleans - Compiling the Data
Baltimore and New Orleans present their city government data differently, so the process for establishing how many shooting incidents Baltimore has had on any given day is different. A good place to start is with Baltimore government spreadsheets showing non-fatal shooting victims and homicide victims dating from the beginning of 2011 through the beginning of June 2015.
Establishing relatively accurate incident totals is critical for analyzing gun violence trends, but, unlike New Orleans, Baltimore’s dataset does not include item numbers to help identify unique incidents. Creating a list of fatal and non-fatal shooting incidents is thus the first priority.
Fortunately, Baltimore’s data are relatively easy to sift through. Homicide victims can be sorted by type of death, which enables identifying fatal shooting victims. Identifying individual incidents requires sorting through victims who were shot on identical dates at identical times at identical locations.
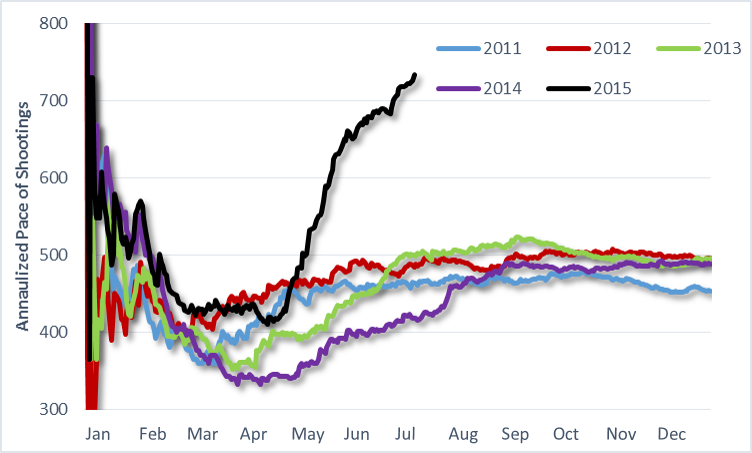
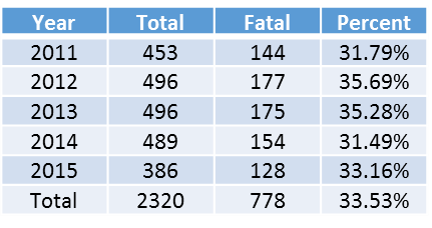
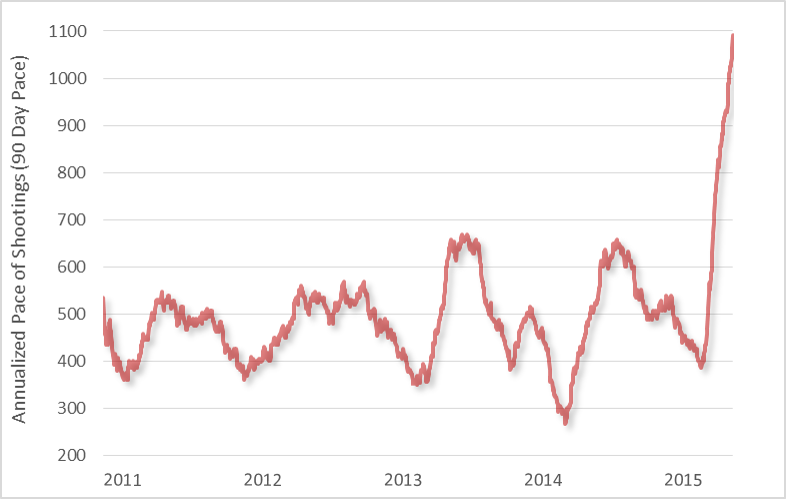
This method produces a list of over 2,300 fatal and non-fatal shooting incidents for each day in Baltimore dating from January 2011 to mid-July 2015. This list shows a relatively steady level of gun violence in Baltimore, with between 453 and 496 shooting incidents each year from 2011 to 2014. As noted elsewhere, particularly in a recent FiveThirtyEight.com piece, shootings have increased dramatically in 2015 since the death of Freddie Gray in mid-April.
With the initial set of data established further analysis can now begin.
Baltimore vs. New Orleans - Fatal Shooting Percentage
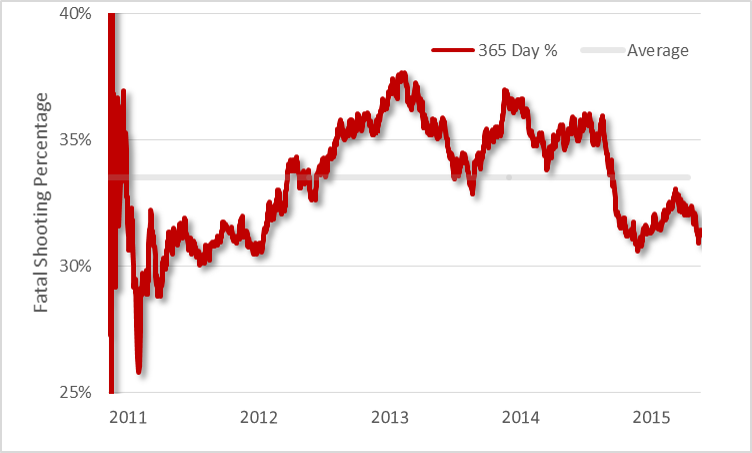
As it turns out, Baltimore is fairly similar to New Orleans in terms of its Fatal Shooting Percentage. Analyzing the aforementioned shooting incident data set shows 33.5 percent of all Baltimore shootings ended in a fatality between January 2011 and mid-July 2015. Over shorter intervals, the percentages was sometimes lower, and sometimes higher. But fatal shootings have tended to regress to a mean of 33.5 percent over the last four and a half years in Baltimore.
Gun violence incidents totals in Baltimore for 2011 through mid-July 2015 are shown in the below table. Interestingly, while the Fatal Shooting Percentage in New Orleans declined from 39 percent in 2011 to 32 percent in 2014 before skyrocketing over 40 percent in 2015, the Fatal Shooting Percentage since 2011 in Baltimore has been more stable, rising in 2012 and 2013, falling in 2014 before rising again in 2015.

Leave a Reply