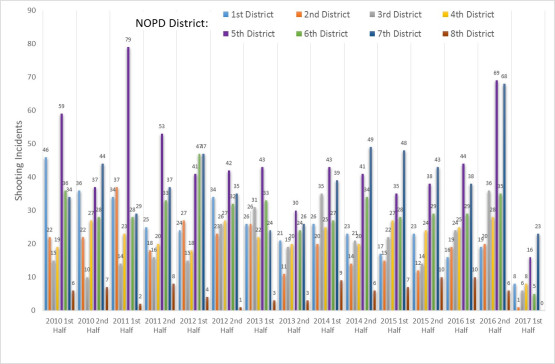
New Orleans gun violence is surging, but that should come as no surprise. There have been 67 shootings and 24 murders as of February 5th, figures which are up 86 percent and 140 percent respectively relative to this point in 2016. The rise in gun violence has complex roots, but digging deeper at the change in policing over the last few years shows one apparent contributor: the drop in drug enforcement.
To begin with it’s useful to look at where gun violence is rising in New Orleans. I’ve written about this before, but any solution to our current gun violence crisis must be centered in the 5th and 7th Districts which are bearing the brunt of the surge. Over a third of all 2017 shootings have taken place in the 7th District (New Orleans East) and early 60 percent of citywide shootings have occurred in the 5th or 7th. There have been 348 shootings in New Orleans since the start of July 2016 and 176 of them have occurred in the 5th or 7th Districts.
I have also previously written about the change in drug enforcement, and specifically the change in Schedule I/II drug enforcement, in New Orleans over the last few years. I wouldn’t argue that the drop in drug enforcement is directly causing the rise in gun violence, but the data suggest it’s a clear contributor in what’s happening in the 5th and 7th Districts right now. The table below shows the change in Schedule I/II incidents per NOPD district during the 7th months after July 2016 (July 2016 to January 2017) relative to the 7 months before (June 2016 to December 2015) as well as the change in shootings per district over that span.
| District | Change in Schedule I/II | Change in Shootings |
| 1st | -21 | 2 |
| 2nd | 3 | -2 |
| 3rd | -7 | 15 |
| 4th | -13 | 6 |
| 5th | -43 | 31 |
| 6th | -1 | 9 |
| 7th | -22 | 42 |
| 8th | 30 | -4 |
The correlation here is strong (R = -.694) although not so strong as to discount a myriad of other potential factors that are also helping to drive gun violence higher. All told there were 9 fewer Schedule I/II enforcements and 26 more shootings in the 1st, 2nd, 3rd, 4th, 6th and 8th Districts combined over the measured timeframe. There were a combined 65 fewer Schedule I/II incidents and 73 more shootings in the 5th and 7th Districts.
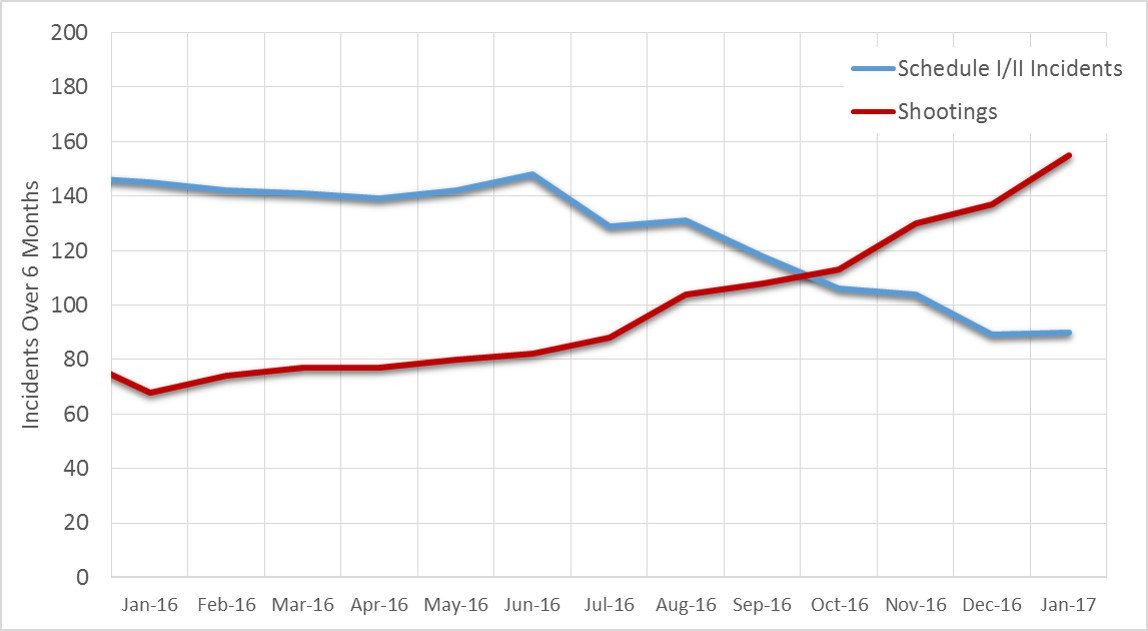
And here’s what that potential relationship looks when graphed since the beginning of 2016. The blue line is the number of Schedule I/II incidents in the 5th and 7th Districts over 6 months and the red line is the number of shooting incidents in those districts over that span. The shootings really didn’t start to take off until mid-2016 just as drug enforcement started falling even further.
 Analyzing changing gun violence in this manner isn’t game changing, but it hopefully adds another piece of evidence that any solution to our rising gun violence needs to focus on finding ways to impact the city’s drug market.
Leave a Reply