A November 2016 Pew article by John Gramlich showed how perceptions of crime tend to conflict with the reality of crime on a national level. Gramlich compared the percentage of people saying crime was rising to the reality of falling violent crime in America over the last two decades as shown in the below graphic.
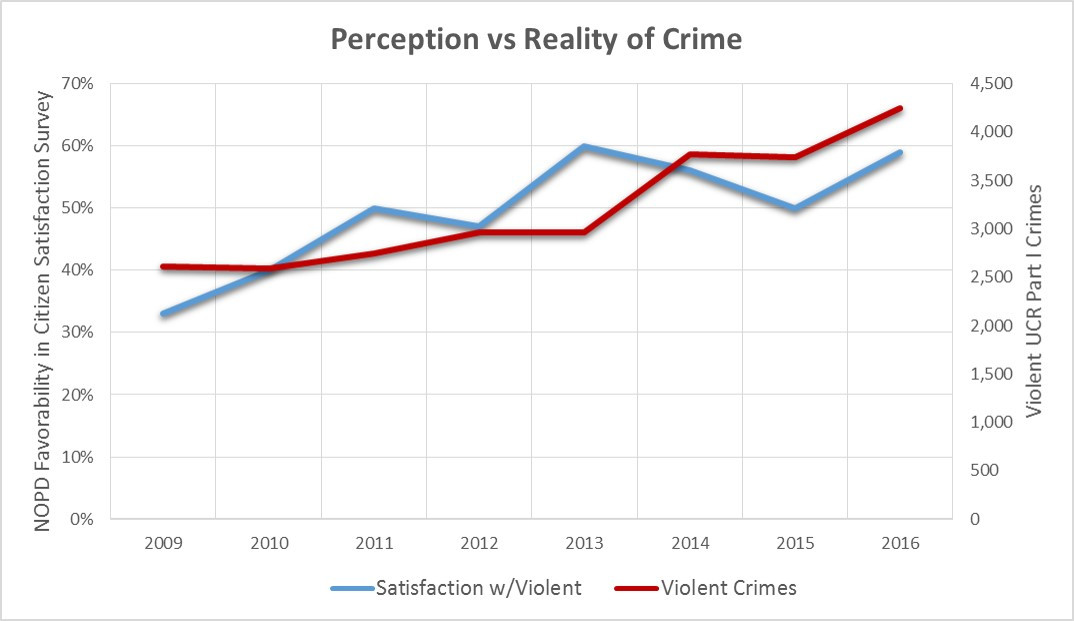
But what about New Orleans? Turns out New Orleanians tend to have similar problems although here satisfaction with how crime is being handled is rising in near lockstep with crime totals.
The New Orleans Crime Coalition has surveyed citizens since 2009 with the most recent occurring in August 2016. I compared the survey results for the Fall of each year (with the exception of 2014 whose only survey was in March 2014) with the number of UCR Part I crimes reported by NOPD to the FBI.
First up is the below graph of NOPD Favorability (blue, left Y-axis) versus the number of violent UCR Part I crimes per year (red, right Y-axis).
There are a few problems with just using favorability rating though. First and foremost, there may be other factors influencing favorability in NOPD beyond crime totals. In addition, these surveys were taken in the Fall (other than 2014) and crime totals are through the end of the year.
The problem of comparing apples to apples is largely taken care of thanks to the surveys’ measurement of how citizens think NOPD is doing specifically against violent and property crimes. The below graph shows citizen satisfaction and violent crime totals steadily rising from 2009 through 2016.
 And here is a similar result for satisfaction with property crimes and actual property crime totals.
These citizen satisfaction surveys are important tools, but it’s critical to not conflate citizen support for how crime is being handled with a belief that satisfaction equals how crime is actually being fought.
Leave a Reply