Absent a significant reduction in gun violence it appears likely that New Orleans will see another jump in murder in 2017.
Thus concluded my 2017 murder forecast published late in December 2016. As we approach nearly five full months into the year it is apparent that both the conclusions and the underlying analysis were spot on.
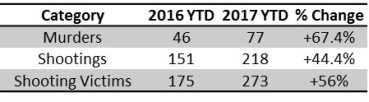
Comparing murders, shootings and shooting victims through May 17 shows all three are up over 40 percent relative to the same time period in 2016. (Note the 2017 murder total includes Deborah Cotton who was shot in 2013 but died in 2017. That incident has not yet been classified as a murder by the coroner).
 The original 2017 forecast piece used Calls for Service with the signal ‘discharging firearms’ (or signal 94) to show how much worse things were getting at the time and how that portended to a bad year unless something dramatic happened.
So what has changed now that we are now in late May? Not a ton.
First a quick note: NOPD’s Calls for Service database provides information on both the final signal that an incident was given as well as the initial signal of the event given by the dispatcher. The vast majority (83.3%) of calls that are initially signal 94 result in that same final type. But sometimes they change to murders, criminal damage, non-fatal shootings, etc. The below chart shows the number of initial Calls for Service marked as 94 per month (note: I’ve removed those signal 94 calls that were ultimately deemed to be fireworks. I also artificially smoothed the days before and after New Year’s Day and July 4th for the sake of accuracy. Because of a quirk in NOPD’s database the initial type of a call is only available from September 2013 on).
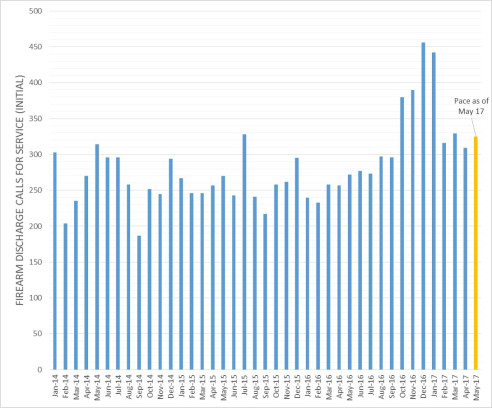
As can be seen discharging firearms increased slowly throughout the second half of 2016 before dramatically increasing from October 2016 through January 2017. The last four months have been relatively stable at a level about 22 percent higher than the monthly average from January 2014 to September 2016.
The result of more firearm discharge reports has been more shootings as shown in the below graph. This graph charts the number of actual shooting incidents over 180 days (blue line) versus the number of expected shooting incidents over 180 days. The latter is calculated by dividing the number of discharging firearm incidents over 180 days by 7.57 which is the number of discharging firearm incidents per shooting from September 2013 to present.
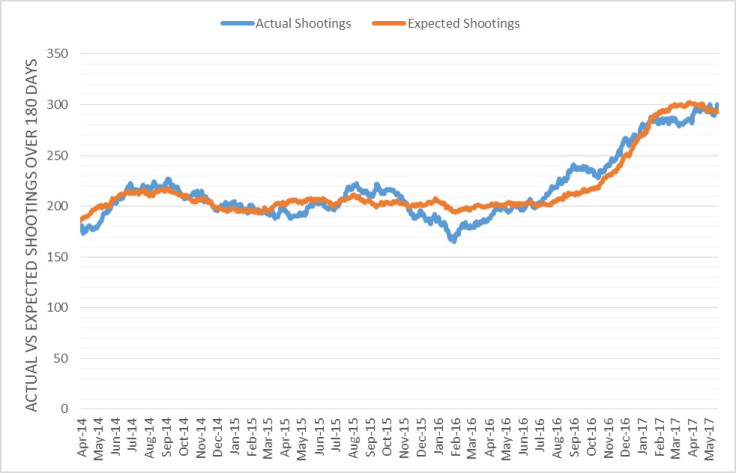
The correlation between expected and actual shootings is quite strong (R = .94) and this chart strongly suggests that shootings have been up because of higher gunfire, not because of bad luck. Applying the same idea to fatal shootings shows the correlation to be slightly less strong (R = .72) but that we can expect one person to be fatally shot for every 21.4 discharging firearm incidents. 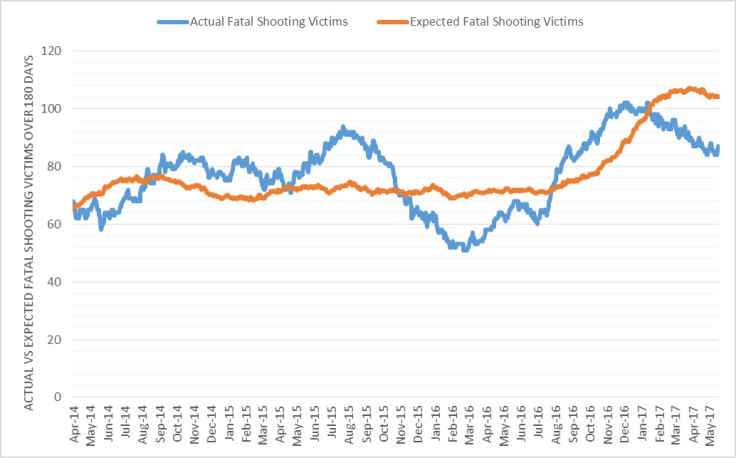 The above graph strongly suggests that, while murder and shootings are up big, things could definitely get much worse at the current level of gun violence. Indeed, the fatal shooting victim chart tends to swing wildly every six months or so which is highlighted by the below scatter plot. Here I charted the difference between the expected and actual fatal shooting victim for every day from mid-2014 along the X-Axis and the swing from exactly 180 days prior along the Y-Axis.
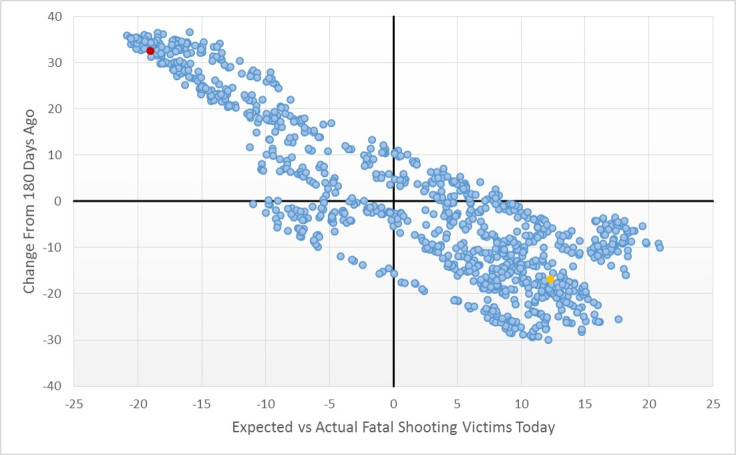
The red dot is May 17th, 2017 and the yellow dot is 180 days ago on November 19, 2016. The top left quadrant shows times of good luck over the last 180 days and bad luck over the preceding 180 days while the bottom right quadrant shows the exact opposite. Today, for example, the city has had 18.2 fewer fatal shooting victims over the last 180 days than expected while on November 19 there had been 13.8 more fatal shooting victims over the preceding 180 days, a lucky swing of 32.
This chart is intended to show how good luck over an extended period of time is almost always replaced with bad luck over an extended period of time and vice versa. Indeed luck swung in 84.3 percent of dots on that graph.
Where will 2017 end up? The math suggests it runs the gamut from slightly bad relative to 2016 to horrifically bad unless the average level of gunfire the city has experienced over the last 8 months decreases significantly.
The main assumption for this forecast is that the level of firearm discharges will remain at roughly the same level they’ve been the last four months at 318 or so per month. Also assuming there’s average luck in terms of shootings over the rest of the year means that 318 discharges per month would translate to about 2,380 discharging firearm incidents over the remainder of the year which, on average, would translate to 314 more shooting incidents.
Two other factors to take into account are the number of non-gun murders (stabbings, drownings, beatings, etc) and the number of non-murder homicides (not all fatal shootings are murders) that are likely to occur over the next 7+ months. On average between 2010 and 2016 there were 6.5 more non-gun murders than non-murder homicides between May 17 and the end of the year.
So the year end murder forecast equation will be the anticipated number of fatal shooting victims at the current rate of violence teased out over the rest of the year + 6.5 + 77 (the current murder total).
The below table produces a pretty wide range of possibilities all of which show a rise in murder over last year’s 174 murders. The good luck scenario sees only a tiny rise while the bad luck scenarios show the city having more murders than any post-Katrina year.
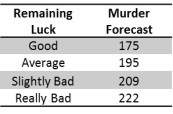
- The good luck scenario involves the current ratio of fatal gunshot victims per initial firearm discharge incident (25.9 to 1) continues over the rest of the year.
- The average luck scenario puts the ratio at 21.4 to 1 which is the average ratio from September 2013 to present.
- The slightly bad luck scenario lowers the ratio to 19 to 1 which is about where it was 180 days ago.
- And the really bad luck puts the ratio at 17.2 to 1 which is the worst sustained luck the city has had in the last few years during the first half of 2015.
How these potential ratios compare can be seen on the below graph.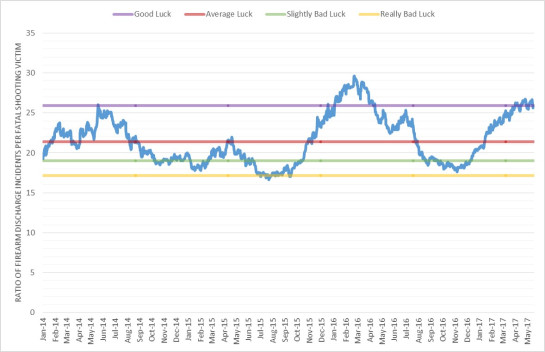 The Optimist’s Case
The main assumption driving the pessimist case is that the level of gun violence will continue at the rate of the last four months for the rest of the year. The case for optimism (or, more accurately, less pessimism) is that there’s no inherent reason the trend over the last four months has to continue over the next seven. Maybe things get worse, but maybe they get better and return to the 2014 to mid-2016 level.
There may be a few small signs of improvement of late. The average daily number of discharging firearm incidents has decreased from 11.3 per day in February to 10.6 in March, 10.3 in April and 10.27 so far in May. In addition the last four days have seen the fewest discharge incidents of any four day stretch since September 2016 (of course there have been 10 shootings and 5 murders over that stretch so not a ton of consolation there).
While there’s no reason gun violence can’t decrease, there’s also no evidence presently available that it will inherently decrease. If the level of gunfire stays roughly the same over the remainder of the year, therefore, the strongest likelihood is that New Orleans will see a big jump in murder in 2017 possibly to levels not seen since pre-Katrina.

Leave a Reply