Back in May I wrote a post titled “The Pessimist’s Murder Forecast for the Rest of 2017 in NOLA.” It predicted doom and gloom based on the available data showing an unexplainable year-long spike in gun violence. Between June 24, 2016 and June 23, 2017 there were 720 people shot in 569 shooting incidents and 206 people murdered in New Orleans. Those totals were +44.1%, +44.3% and +31.2% respectively relative to the city’s average gun violence from 2013 to 2015.
That article concluded with an optimistic caveat though, saying:
“The main assumption driving the pessimist case is that the level of gun violence will continue at the rate of the last four months for the rest of the year. The case for optimism (or, more accurately, less pessimism) is that there’s no inherent reason the trend over the last four months has to continue over the next seven. Maybe things get worse, but maybe they get better and return to the 2014 to mid-2016 level.”
It is possible that the optimistic scenario is unexpectedly coming true in the latter half of 2017.
New Orleans averaged 1.6 shooting incidents per day over the first six months of 2017 but there have been just 1.1 shooting incidents per day over the last 45 days. A below average rate of fatalities with those shootings (just 12 of 51 or 23.5 percent) has led to a dramatic reduction in murder citywide over the last month and a half.
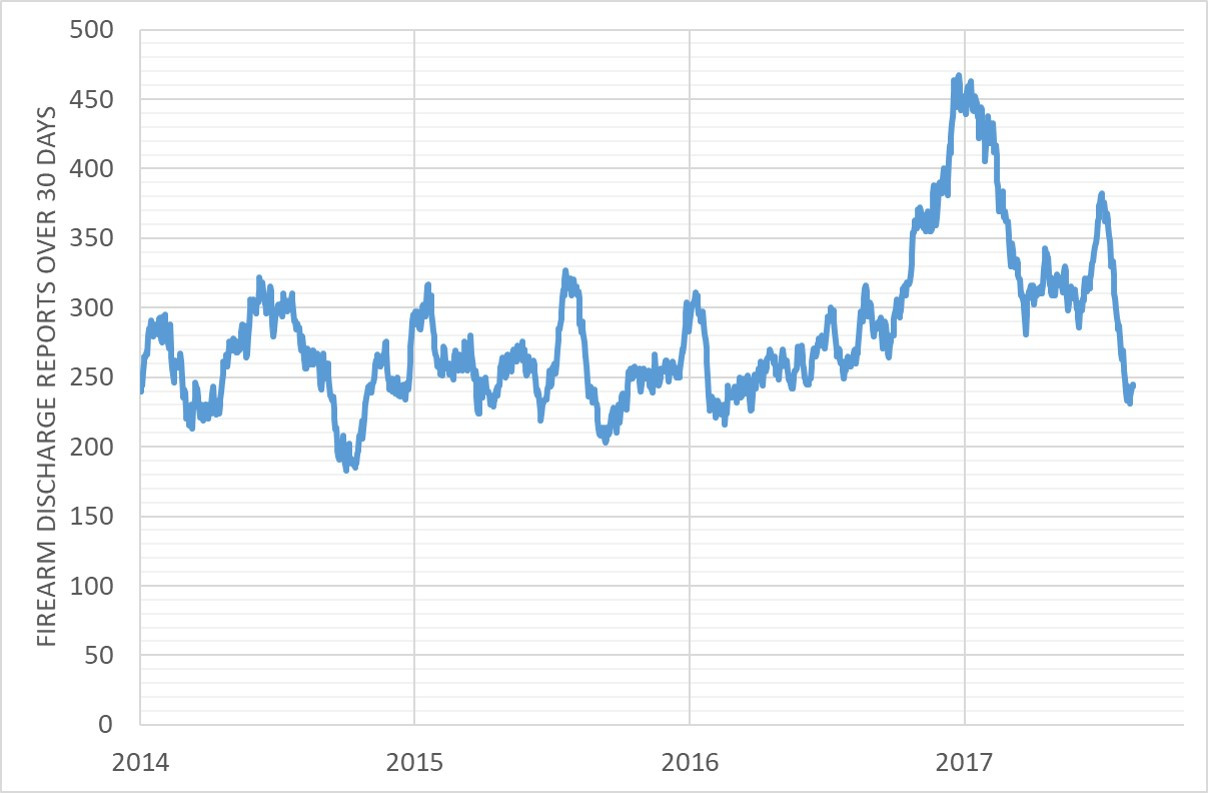
Tracking firearm discharge reports over 30 days shows the slowdown was as dramatic as it was unexpected and welcome given the higher level of gun violence here over the last year.
I can’t say definitively why gun violence spiked in New Orleans over the last year and I can’t say definitively why it has slowed down over the last 6 weeks. As a New Orleanian I cheer the slowdown in gun violence though as an analyst I am frustrated by an inability to concretely argue why it spiked and slowed. I’m not sure what the rest of the year will look like, but here are three potential explanations that jump out to me as plausible for trying to explain the current trend.
1) A Change in Policing:
NOPD lost 30 percent of its manpower between 2010 and 2016. While the department’s manpower has grown slightly in 2017, there is evidence that the department is doing more which may be helping to deter gun violence.
For example, two measures of police proactivity — illegal weapons and Schedule I - IV drug incidents — have spiked at various points in 2017 as shown in the below two tables.


It’s would be hard to argue that these increases in policing will have a dramatic, long term impact on gun violence, especially since a plurality of illegal gun incidents occur in NOPD’s 8th District (CBD and FQ). But it’s certainly plausible that they could contribute to a short term trend.
One other contributing factor could be an increase in murder clearances over the last few months. The incomparable NOLA.com commenter Muspench shared her spreadsheet of murder clearances and…yep, there has been a spike in the last few months. Fewer serial murderers on the streets could undoubtedly be helping to reduce gun violence citywide.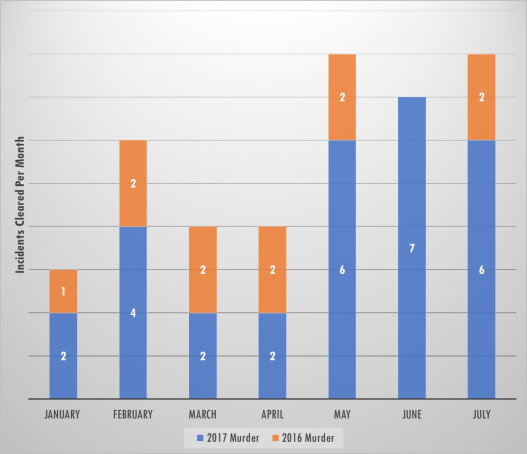
This rise in arrests may be a temporary change or may be reflective of the NOPD’s re-dedication of resources last March to the TIGER unit which was initially set up to fight armed robberies. Using NOPD’s Electronic Police Report database it is possible to determine the percentage of shootings that are being marked ‘Closed’ presumably because they are solved. Doing this shows that a higher percentage of shootings are being closed over the last few months though it’s still only about 1 in 5. 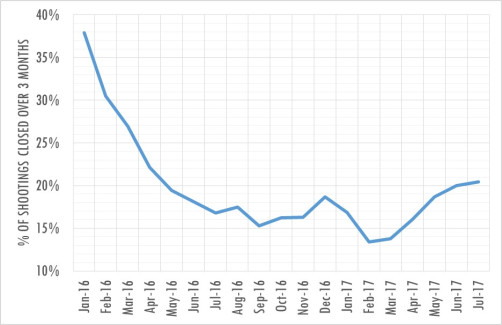
2) Gun Violence Tends To Have Peaks And Valleys Here:
Take a closer look at the firearm discharge chart I put up a few paragraphs ago (reproduced below).
With spikes tend to come valleys. In other words, the last year of nearly much higher gun violence is what’s unusual, the slowdown in gun violence over the last 6 weeks is normal. Perhaps it was also the torrential rains or flooding or heat which helped lead to a slowdown. Either way, our recent history seems to suggest we were overdue for a drop in violence.
3) August and September Tend To See Less Gun Violence
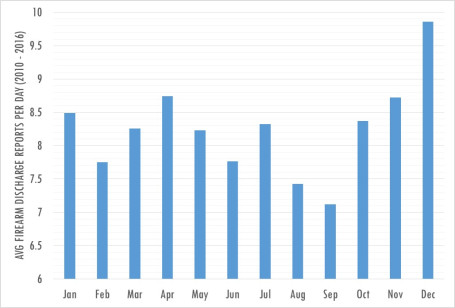
I wrote about this phenomenon last year at about this time. In general there are fewer firearm discharge reports in August and September than any other month of the year though that doesn’t always translate into fewer shootings and murders. This can be clearly seen in the below chart of average firearm discharge reports per day for each month between 2010 and 2016.
Conclusion:
The above three explanations all plausibly help to describe why gun violence is slowing down in New Orleans though they aren’t wholly convincing either. None of the explanations leads one to conclude that there has been a dramatic turnaround in the fight against gun violence but all of them give some hope that the horrors of the past year are in our past. A return to the violence levels of 2013 to mid-2016 right now still means the city will have one of the country’s highest murder rates, but it also suggests there’s reason for optimism that sustainable murder reduction can eventually be achieved.

Leave a Reply