NOPD released data on the department’s Electronic Police Report (EPR) system last week and it presents a phenomenal opportunity to learn more about both crime patterns and policing in New Orleans through fully open data. First things first, let me explain what EPR is. The city’s Calls for Service (CFS) database is essentially a metadata record of every action the police take. If you call 911 because your car has been stolen, CFS creates a record of the call to include the NOPD item number, date/time of the call, location of the incident, time an officer was dispatched, and the disposition (AKA what the officer found when he or she got to the scene).
If the officer can’t be dispatched for a few hours then there’s a good chance the victim will have left the scene and the call will be given an ‘Unfounded’ or ‘Gone on Arrival’ disposition. It’s oversimplifying, but if the officer arrives and finds a criminal offense has occurred then a record must be made of the crime and the call receives a ‘Report to Follow’ disposition.
EPR is the database where those reports go. So the new open data provided by NOPD gives way more insight into the types of crimes that are occurring as well as the degree to which they are being solved by telling us what happens during the investigation. EPR provides information on whether an arrest is made, what specific criminal violation occurred (not just drug violation but possession of marijuana), and the race, sex, and age of both the victim and offender when known.
This data set enables one to more thoroughly break down overarching crime categories. For example, analysis of EPR shows that while arrests for all drug violations have gone down 43 percent from 2012 to 2016, municipal marijuana offenses (possession of trace amounts or first time offenses under the city’s municipal rather than Louisiana’s criminal code) have only gone down 18 percent over that span. So a drop in marijuana enforcement is not what’s responsible for a citywide decline in drug enforcement.
| Year | Marijuana | All Drug Violations |
| 2012 | 974 | 3318 |
| 2013 | 1039 | 3204 |
| 2014 | 843 | 2537 |
| 2015 | 808 | 2137 |
| 2016* | 797 | 1893 |
| Change 2016 - 2012 | -18.2% | -42.9% |
| *Pace as of 10/6/2016 | ||
Another thing this data set enables is the ability to measure clearance rates for various crimes in near real time. The first thing that popped into my mind was to measure whether the creation of NOPD’s anti-armed robbery TIGER team in May 2016 was leading to more armed robbery arrests. To do that I figured out the percentage of armed robbery incidents ending in an arrest over 180 days and found that there’s no real evidence of increasing armed robberies over the last six months.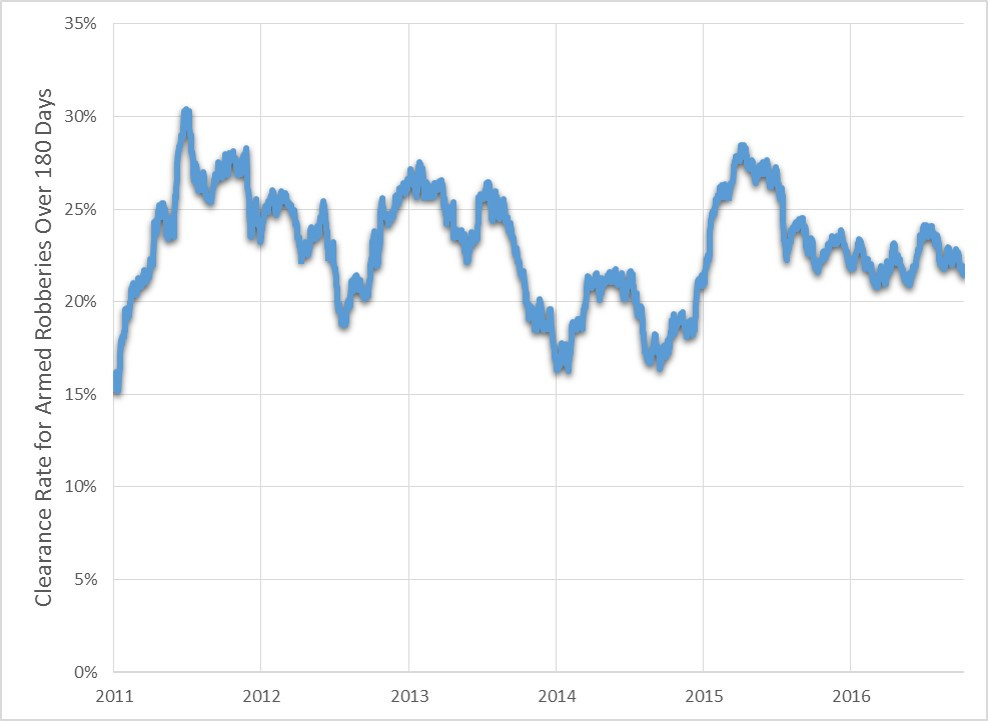 NOPD has made an arrest in 23.2 percent of armed robberies from 2011 to 2015, and in 2016 the department is recording an arrest in a virtually identical 22.5 percent of armed robberies. The average robbery (both simple - no weapon - and armed) clearance rate for a department of NOPD’s size in 2015 was 25.8 percent according to the FBI, so these numbers are not particularly bad, but they do suggest that things have been fairly steady in terms of rate and not getting much better. Of course the number of armed robberies in New Orleans from 2014 to 2016 has been much higher than from 2011 to 2013, so the number of robberies solved is up, but the rate has not improved.
This is just a sample of what NOPD’s new EPR open data can provide, there are tons of other possibilities out there waiting to be explored.

Leave a Reply